InTDS ArchivebyTorsten WalbaumWhat 10 Years at Uber, Meta and Startups Taught Me About Data AnalyticsAdvice for Data Scientists and ManagersMay 30, 20246.6K104May 30, 20246.6K104
InGorilla Tech BlogbyAlexander BaderHow can we quantify similarity between time series?Comparing metrics for time series clustering…May 27, 20217519May 27, 20217519
InThe PythoneersbyThomas KonstantinovskyCross-Correlation and Coherence in Time Series Analysis: How to Uncover Relationships between…Exploring Lead-Lag Dynamics and Synchronization in Signals Using Cross-Correlation and CoherenceOct 1, 20242071Oct 1, 20242071
InTDS ArchivebySaankhya MondalGame Theory, Part 1 — The Prisoner’s Dilemma ProblemGame theory is prevalent in real-life scenarios and decision-makingOct 22, 20241482Oct 22, 20241482
InTDS ArchivebyTDS Editors2024 Highlights: The AI and Data Science Articles That Made a SplashThe stories that resonated the most with our community in the past yearDec 19, 20245206Dec 19, 20245206
InTDS ArchivebySofya Lipnitskaya100 Years of (eXplainable) AIReflecting on advances and challenges in deep learning and explainability in the ever-evolving era of LLMs and AI governanceDec 18, 20242827Dec 18, 20242827
InTDS ArchivebyAngela & Kezhan ShiWhat Bias-Variance Bulls-Eye Diagram Really RepresentAnd what is its relationship with underfitting and overfittingJun 4, 20212701Jun 4, 20212701
Pelin OkutanBoard Games and Decision Making with Markov ChainsBoard games are a classic pastime that not only provide entertainment but also present fascinating opportunities for analysis and strategy…Jul 21, 2024961Jul 21, 2024961
InTDS ArchivebyCassie KozyrkovMetric Design for Data Scientists and Business LeadersWhat’s the hardest part of metric design?Oct 23, 20221.4K6Oct 23, 20221.4K6
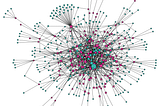
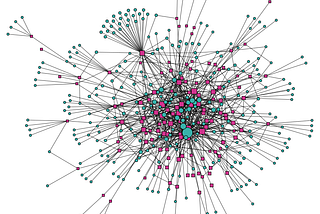
Indunnhumby Science blogbyRoxana PamfilNetwork models for recommender systemsUsing techniques from network science to predict new interactions between users and itemsMar 27, 20195846Mar 27, 20195846
InTDS ArchivebyDaniel Manrique-CastanoDo not over-think about ‘outliers’, use a student-t distribution insteadThe Student’s t-distribution provides a robust alternative to acknowledge that our data may be populated by extreme observations…Mar 30, 20245277Mar 30, 20245277
InAI AdvancesbyMarco Moscatelli3 Common Errors You Make in Time Series AnalysisDefinition and use cases of common errors found in modern machine learning modelsNov 1, 2024248Nov 1, 2024248
InTowards AIbyGencay I.This Pandas Trick Will Blow Your Mind As a Data Scientist!Automate Data Analysis with PandasNov 1, 202458610Nov 1, 202458610
InData Science CollectivebyJoão Paulo FigueiraGPS Interpolation Using Maps and KinematicsHow do you apply dead reckoning to your geospatial dataset?Dec 3, 2024971Dec 3, 2024971
InTDS ArchivebyDario Radečić5 PCA Visualizations You Must Try On Your Next Data Science ProjectWhich features carry the most weight? How do original features contribute to principal components? These 5 visualization types have the…Aug 2, 20247638Aug 2, 20247638
InTDS ArchivebyLenix CarterInformation in NoiseTwo Techniques for Visualizing Many Time-Series at OnceSep 3, 20242352Sep 3, 20242352
InTDS ArchivebyClaudia NgThe Most Expensive Data Science Mistake I’ve Witnessed in My CareerWhy true success in machine learning goes beyond optimizing a single metricNov 28, 20241.3K29Nov 28, 20241.3K29
InTDS ArchivebyCassie KozyrkovWhat’s the Hardest Part of Metric Design?Metric design for data scientists and business leadersOct 25, 20223711Oct 25, 20223711
InTDS ArchivebyBoriharn K7 Visualizations with Python to Express Changes in Rank over TimeUsing Python to visualize the changes in rank over time.Nov 28, 20223223Nov 28, 20223223
MCMC AddictInvitation to reliability engineering through a nice Python libraryThat can also be applied to human survival analysisFeb 20, 202412Feb 20, 202412